
Observability
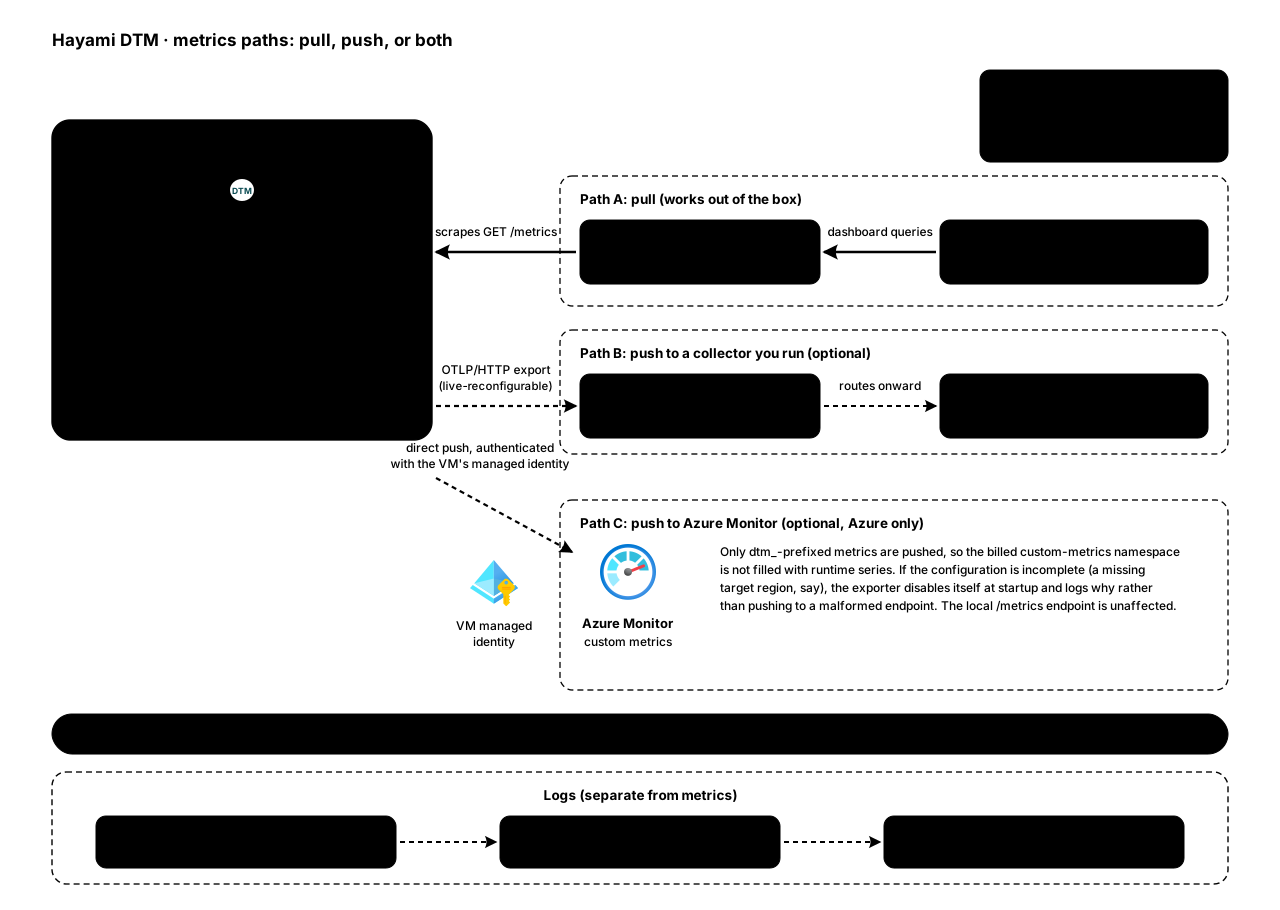
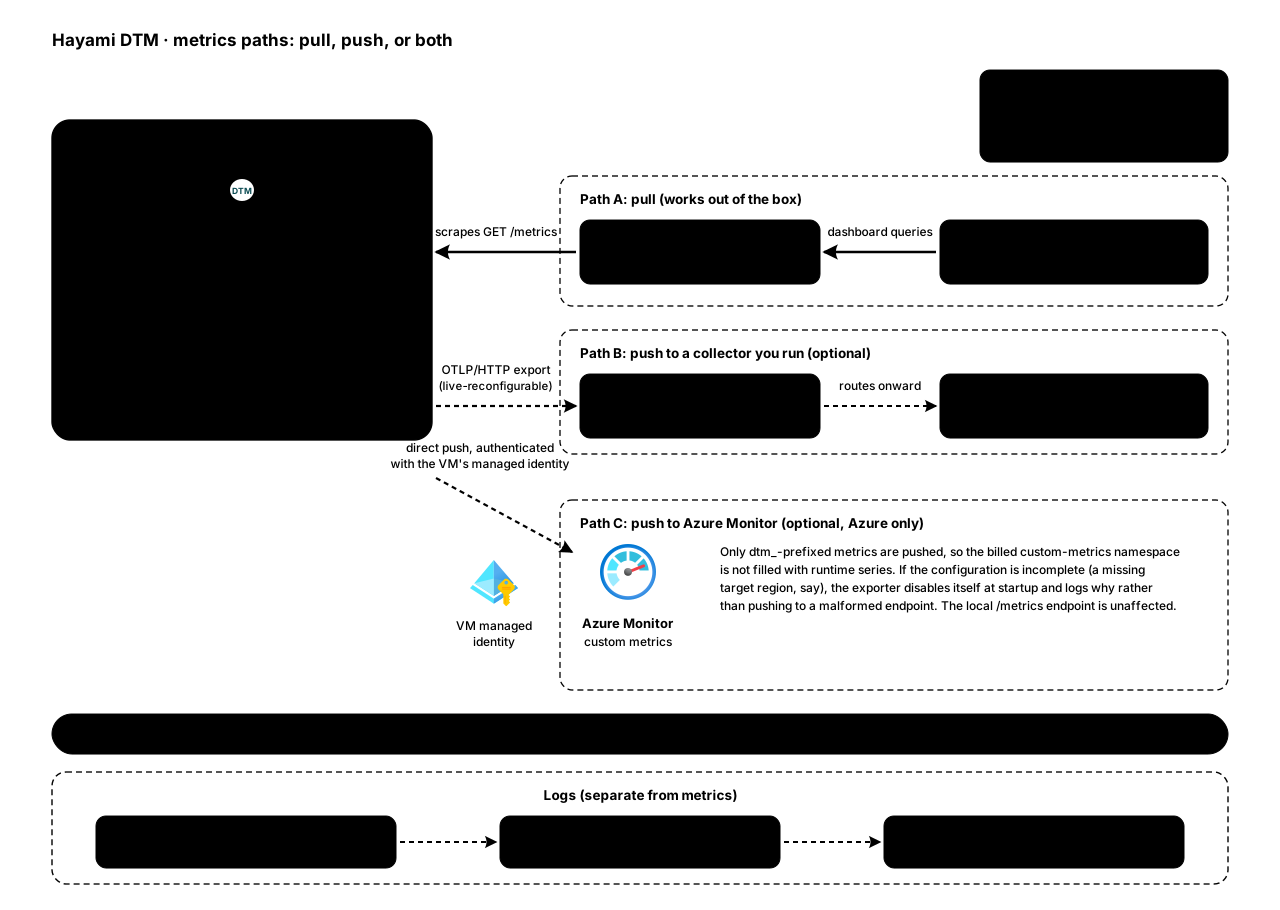
DTM exposes Prometheus metrics out of the box and can optionally push them to an OTLP collector you manage. Both give you visibility into DNS traffic, health, replication, and cluster state. The paths coexist: enable any combination, and the local metrics endpoint always exposes everything regardless. For discrete operational events pushed to an incident channel (failover activated, backup failed) rather than scraped metrics, see notifications.
Prometheus metrics
Section titled “Prometheus metrics”Every node serves Prometheus-format metrics at:
GET /metricsThis endpoint is unauthenticated so your scraper can reach it; gate it at the network layer (NSG / firewall) to control who can. Point Prometheus at each node:
scrape_configs: - job_name: dtm metrics_path: /metrics static_configs: - targets: - dtm-node-1:8443 - dtm-node-2:8443 - dtm-node-3:8443 scheme: https tls_config: insecure_skip_verify: falseKey metric families
Section titled “Key metric families”All DTM metrics are prefixed dtm_. The most useful:
| Area | Metrics |
|---|---|
| DNS | dtm_dns_queries_total, dtm_dns_query_duration_seconds, dtm_dns_cache_hits_total, dtm_dns_cache_misses_total |
| Health | dtm_health_check_drops_total, dtm_health_warmup_duration_seconds |
| Cluster / replication | dtm_cluster_nodes, dtm_replication_last_sync_timestamp_seconds |
| API | dtm_api_requests_total |
| Storage | dtm_storage_db_bytes, dtm_storage_bbolt_free_pages, dtm_storage_free_bytes, dtm_storage_artifact_files, dtm_storage_bbolt_page_writes_total, dtm_storage_bbolt_write_seconds_total, dtm_storage_bbolt_read_tx_total |
| Node / liveness | dtm_node_info (carries the version label), dtm_node_uptime_seconds, dtm_heartbeat, dtm_process_start_unixtime |
| Backups | dtm_backup_last_success_timestamp_seconds, dtm_backup_scheduled_failures_total{stage}; alerts on backup and restore |
| Notifications | dtm_notify_delivered_total{sink}, dtm_notify_failed_total{sink}, dtm_notify_dropped_total, dtm_notify_suppressed_total; see notifications |
| Region discovery | dtm_region_discovery_mappings_pending_add, dtm_region_discovery_mappings_pending_remove (always 0 after an incomplete cycle), dtm_region_discovery_last_run_timestamp_seconds, dtm_region_discovery_last_cycle_complete (sustained 0 usually means a lost Reader grant), dtm_region_discovery_run_errors_total |
Grafana dashboard
Section titled “Grafana dashboard”A pre-built Grafana dashboard covering DNS traffic, latency, health, replication, and cluster state is available from support. Import it into your Grafana and point it at your Prometheus data source.
Useful things to alert on:
- Storage growth:
dtm_storage_bbolt_free_pagesabove 50% of total pages sustained for 6 hours (the shippedDTMBboltFreelistBloatrule’s hold) suggests it is time to compact. - Cluster health:
dtm_cluster_nodesbelow your deployed node count (each node reports the number of cluster members it can currently see). - Replication lag: a growing gap in
dtm_replication_last_sync_timestamp_seconds. - Unexpected write load: on a converged cluster with no configuration
changes or dynamic updates in flight, the rate of
dtm_storage_bbolt_page_writes_totalshould sit near zero; sustained page writes mean something is rewriting unchanged state. Risingdtm_storage_bbolt_write_seconds_totalwith a flat page-write rate points at a slow disk instead.
See SLA and SLO for target thresholds and burn-rate alerting recipes.
OTLP export (optional)
Section titled “OTLP export (optional)”Instead of (or as well as) being scraped, DTM can push its metrics to an
OTLP/HTTP collector you run, which can route them onward to Azure Monitor and/or
a Grafana/LGTM stack. Configure it over the API ($DTM_TOKEN is a bearer token;
see authentication), or with
Terraform:
curl -sk -X PUT https://dtm.internal:8443/api/v1/observability/otlp \ -H "Authorization: Bearer $DTM_TOKEN" \ -H "X-DTM-CSRF: 1" \ -H "Content-Type: application/json" \ -d '{ "enabled": true, "endpoint": "https://otel-collector.internal:4318", "headers": {"x-api-key": "<collector-token>"}, "interval_seconds": 30 }'The change is applied to the live exporter without a restart. A few notes:
- These endpoints only turn DTM’s export on or off and set where to send it; they configure nothing on the receiving side.
- Header values are stored encrypted and returned redacted (
***). Resubmitting***or an empty value preserves the stored secret. - An
http://endpoint sends metrics without transport security (the OTLP-standard meaning of “insecure”); usehttps://with a trusted certificate for anything sensitive. - The metrics exporter is configurable today; OTLP log export is not yet available.
For Azure deployments, DTM can also push metrics directly to Azure Monitor
custom metrics (enabled in the server configuration, authenticating with the
VM’s managed identity). Only DTM’s own dtm_-prefixed metrics are pushed, so
the billed custom-metrics namespace is not filled with runtime series; the
local /metrics endpoint is unaffected and still exposes everything. If the
Azure Monitor configuration is incomplete, for example the target region is
missing, the exporter disables itself at startup and logs why, rather than
pushing to a malformed endpoint.
Azure Monitor workbook and KQL alerts
Section titled “Azure Monitor workbook and KQL alerts”DTM ships an Azure-native counterpart to the Grafana dashboard: a pre-built
Azure Monitor workbook plus six KQL alert queries
(deploy/azure-monitor/), available from
support. Two independent data
streams feed it; enable the ones you need in the server configuration:
- Query log to Log Analytics (traffic panels and all six alerts):
azure.monitor_enabled: trueplus the query log and theazure.log_analytics_workspace_idandazure.log_analytics_workspace_keypair. Queries land in theDTMLogs_CLtable. The query log itself (enabled,sample_rate) is runtime-configurable: onePUT /api/v1/config/query-log(admin role) or thedtm_query_log_configTerraform resource applies live on every node with no restart, and the persisted runtime value wins over theobservability.query_log_*YAML keys at the next boot. Theazure.*shipper keys stay boot-time file settings, andmonitor_enabledis the master switch for the Azure Monitor exporter: without it the query log is collected but never shipped, so the table stays empty even with the workspace settings in place. - Custom metrics (cluster-health charts): the Azure Monitor push described
above (
azure.monitor_enabled,monitor_resource_id,monitor_region).
Import the workbook JSON via the portal (Monitor, Workbooks, Advanced Editor)
or as a Microsoft.Insights/workbooks resource in your IaC. The alert
queries cover NXDOMAIN floods per client, SERVFAIL surges, REFUSED spikes,
error-response rate, high p95 latency, and query-volume collapse, each with a
tunable threshold; create them with az monitor scheduled-query create or
the equivalent Terraform resource.
DTM logs to the system journal by default. For deployments that ship logs centrally, forward the journal to your log pipeline (for example Azure Log Analytics) using your standard agent.
Two retention decisions are worth making deliberately:
- On the node, journald’s own limits decide how much local history
survives a busy day or a reboot. Persistent storage with a sensible cap
(
Storage=persistentand aSystemMaxUseof a few hundred MB injournald.conf) keeps enough history for incident forensics without filling the OS disk. - In Log Analytics, the workspace’s retention setting governs how long
shipped logs stay queryable. The Terraform deployment’s monitoring module
exposes it as
retention_in_days(default 30). Use 90 or more for production, and 365 or more where a compliance regime such as SOC 2 or PCI applies; the module’stotal_retention_in_dayscan keep older data in the low-cost archive tier so long retention stays affordable.
The audit log (who changed what in DTM) is separate from operational logs and has its own bounded retention; see audit log retention.