
Using the web UI
The web UI is the point-and-click surface for administering DTM. It covers nearly everything the REST API does, so it is a good way to get familiar with DTM before automating with Terraform.
The UI serves HTTPS on port 8080 with the managed UI certificate
(self-signed at first boot); see
TLS certificates to install one your browsers
trust.
Signing in
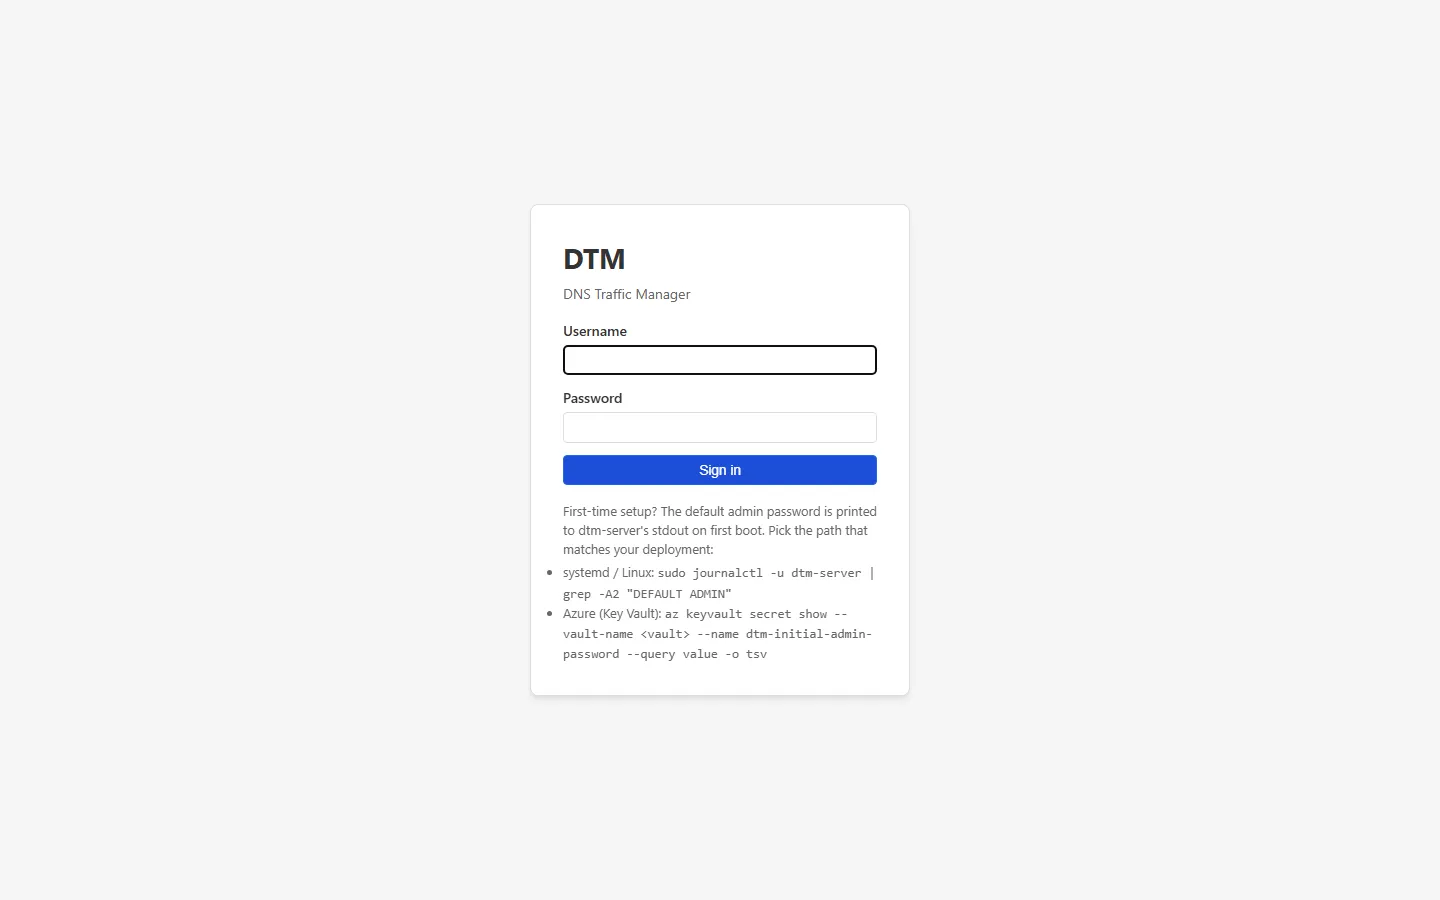
Section titled “Signing in”Open the UI in a browser and sign in with your DTM username and password, or with
Sign in with Microsoft if Entra ID SSO is configured.
Your role determines what you can do: the UI’s write controls
are admin-only, while readonly and editor users see everything without
edit affordances (editor accounts make their changes through the
API or Terraform instead).
Navigation
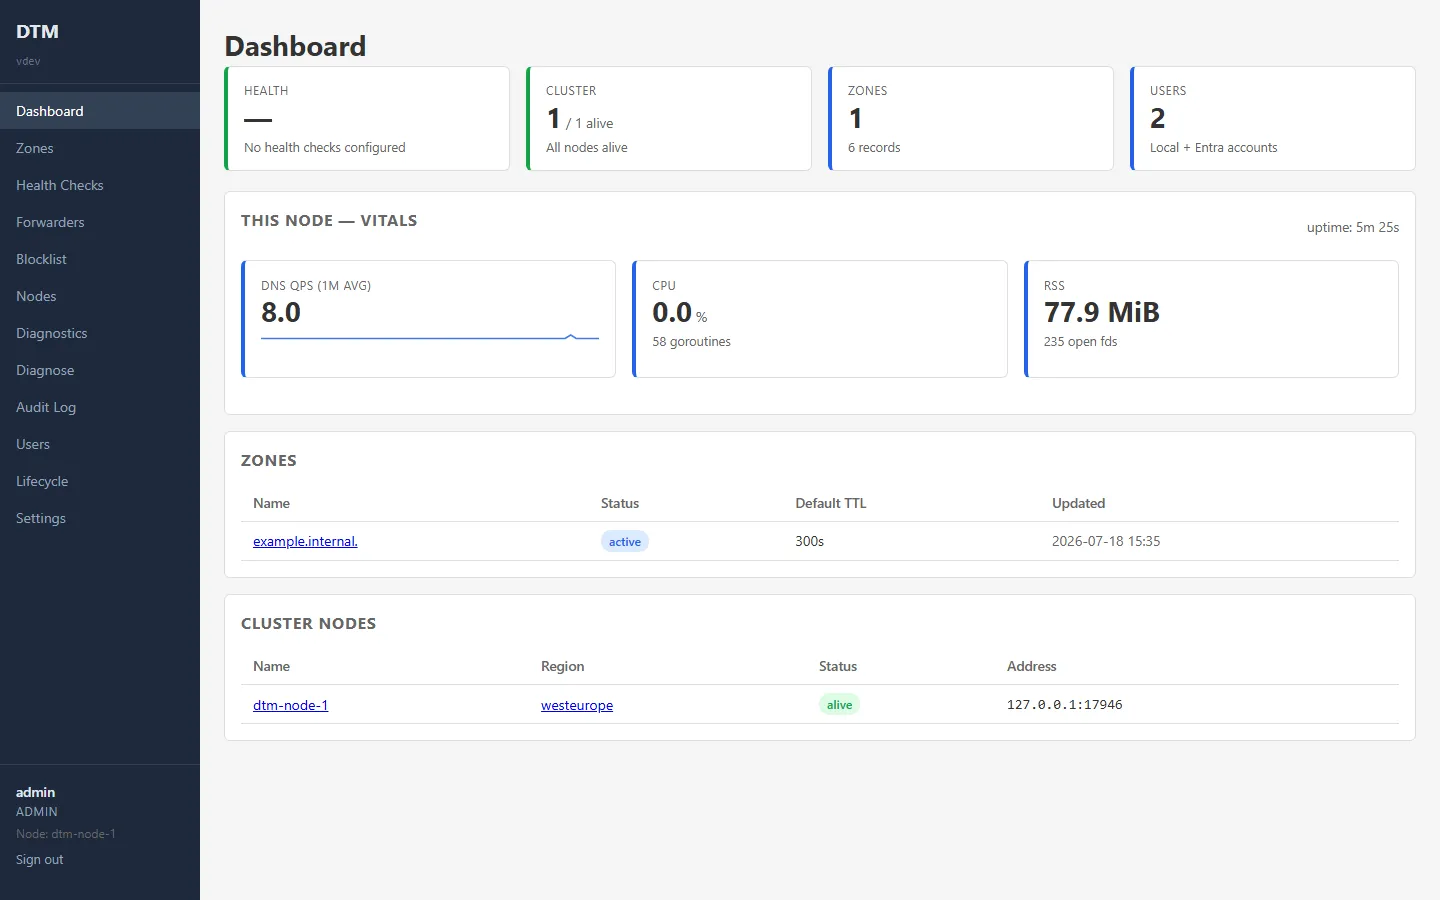
Section titled “Navigation”The left navigation gives you:
- Dashboard - at-a-glance cluster and DNS status.
- Zones - your authoritative zones; open a zone to manage its records.
- Health Checks - health-check status across your backends.
- Forwarders - default and conditional forwarders, and stub zones.
- Overrides - override records: admins create, edit, enable/disable, and delete them here, behind guardrails that preview the name’s current resolution path and restate the effect before you commit.
- Blocklist - the DNS blocklist.
- Nodes - cluster members and their status.
- Tools - an ad-hoc DNS query tester and reachability checks against the
node the UI is talking to. Query results name the pipeline stage that decided
the answer (blocklist, cache, authoritative, override, conditional forwarder,
or default forwarder), and the UDP/53 reachability row sends a real DNS
query, so
okmeans the peer actually answered DNS. - Diagnose - read-only configuration and cluster-health checks, plus a downloadable support bundle: a single redacted zip of config, diagnostics, and cluster state to attach when you escalate to support.
- Audit Log - the audit log of changes.
- Users - user and role management (admin only).
- Lifecycle - cluster version and update status.
- Settings - subnet mappings, discovery scopes (with review-and-apply of discovered changes), TSIG keys, backup and restore, and other cluster settings.
Create a zone
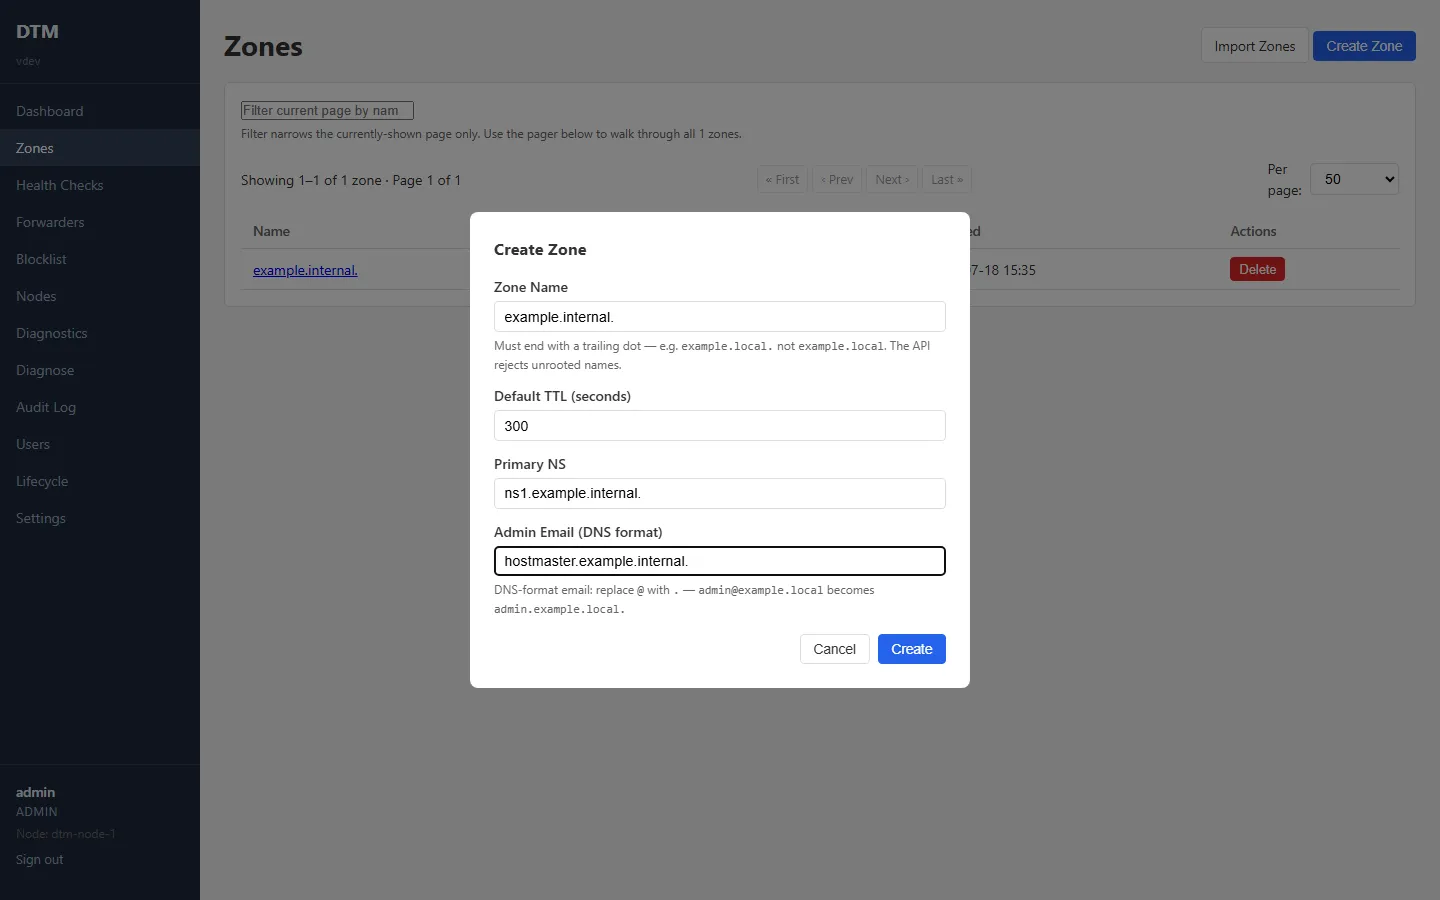
Section titled “Create a zone”- Go to Zones and choose Create Zone.
- Enter the zone name as an FQDN (for example
example.internal.) and a default TTL. - Save. The zone shows as active immediately and reaches the other nodes within moments.
A zone can carry a deletion lock, shown as a padlock on the zones list. The zone detail page has a Lock/Unlock toggle; while locked, the zone refuses deletion from every surface (UI, API, and Terraform), so deleting it is a deliberate two-step. See deletion locks.
Add a record
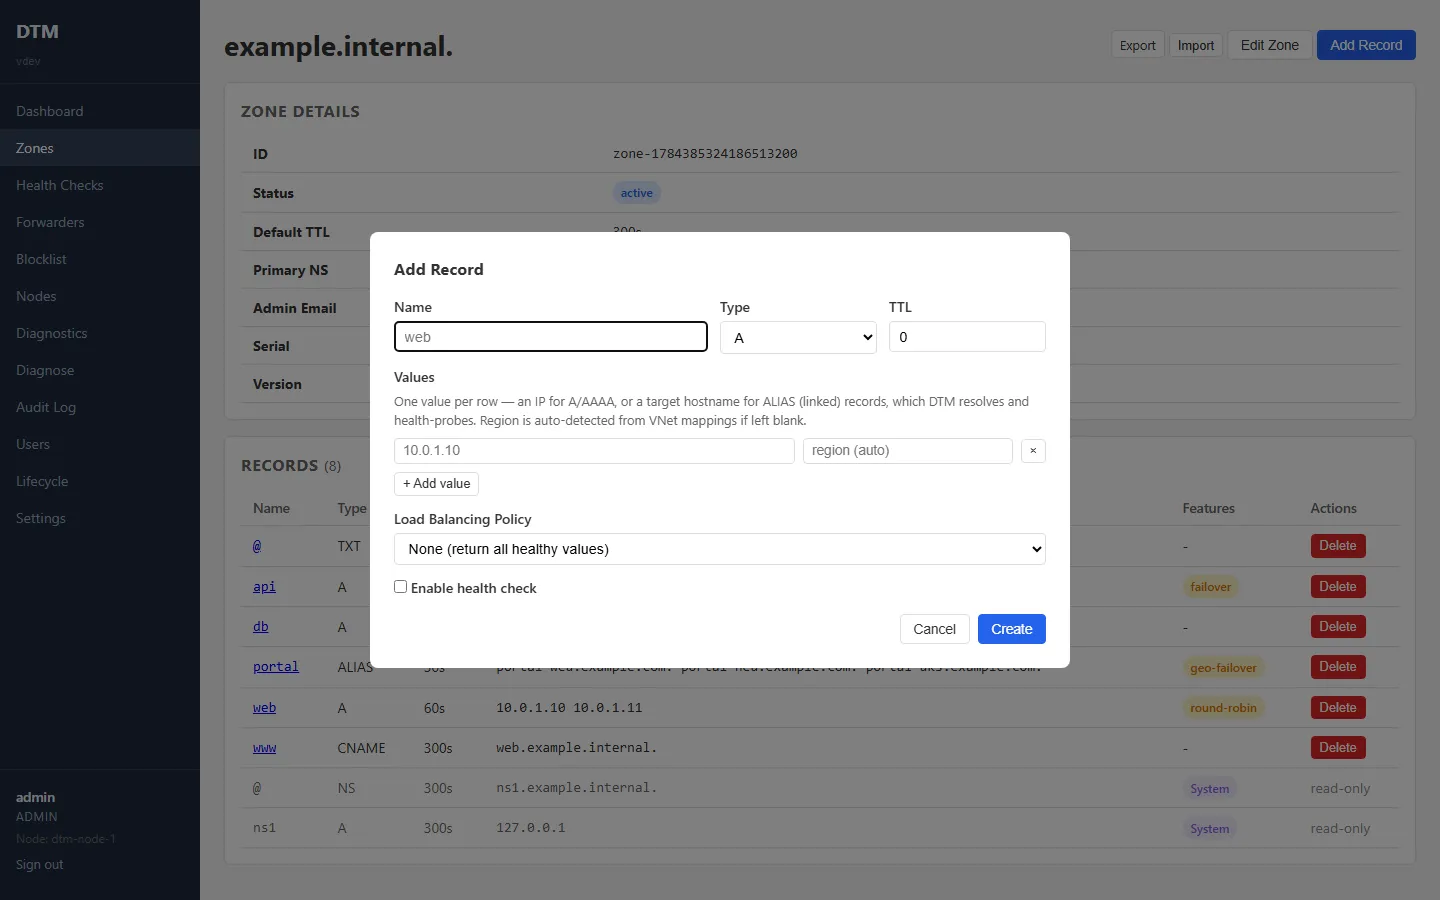
Section titled “Add a record”- Open a zone and choose Add Record.
- Set the name (relative to the zone, or
@for the apex), the type (A,AAAA,CNAME,TXT,ALIAS, and so on), and a TTL.MXandSRVrecords carry priority/weight/port metadata the form does not collect yet; the form offers but refuses them, so create those viaPOST /api/v1/zones/{id}/recordsor the dtm Terraform provider. - Add one or more values. For
A/AAAArecords these are backend addresses; for an ALIAS record, choose type ALIAS and enter downstream hostnames. - Save.
Configure load balancing and health checks
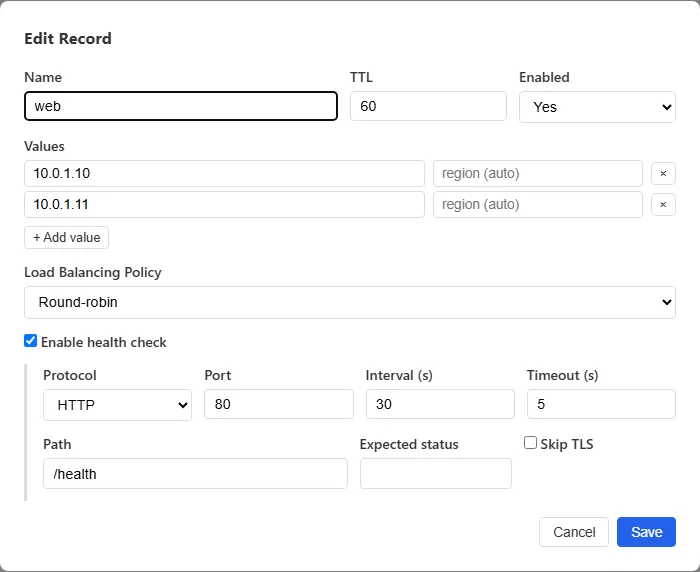
Section titled “Configure load balancing and health checks”When a record has more than one value, configure how DTM chooses between them:
- On the record, open the Load balancing section and choose a method: round-robin, failover, latency, region, geo-failover, or weighted (with per-value percentages). Client affinity is configured through the API or Terraform and shown read-only on the record page.
- Open the Health check section and choose a probe: TCP, HTTP, or HTTPS, with a port, path, interval, and timeout. See health checks.
- For an HTTPS probe against an auth-gated backend, the Authentication
selector adds OAuth2, mutual TLS, or Azure Managed Identity credentials,
plus an optional CA pin, without exposing a public
/healthz. See authenticated health probes. The record page summarises the configured method (never the secrets). - Save. DTM begins probing the values and returns only healthy ones.
View health and cluster status
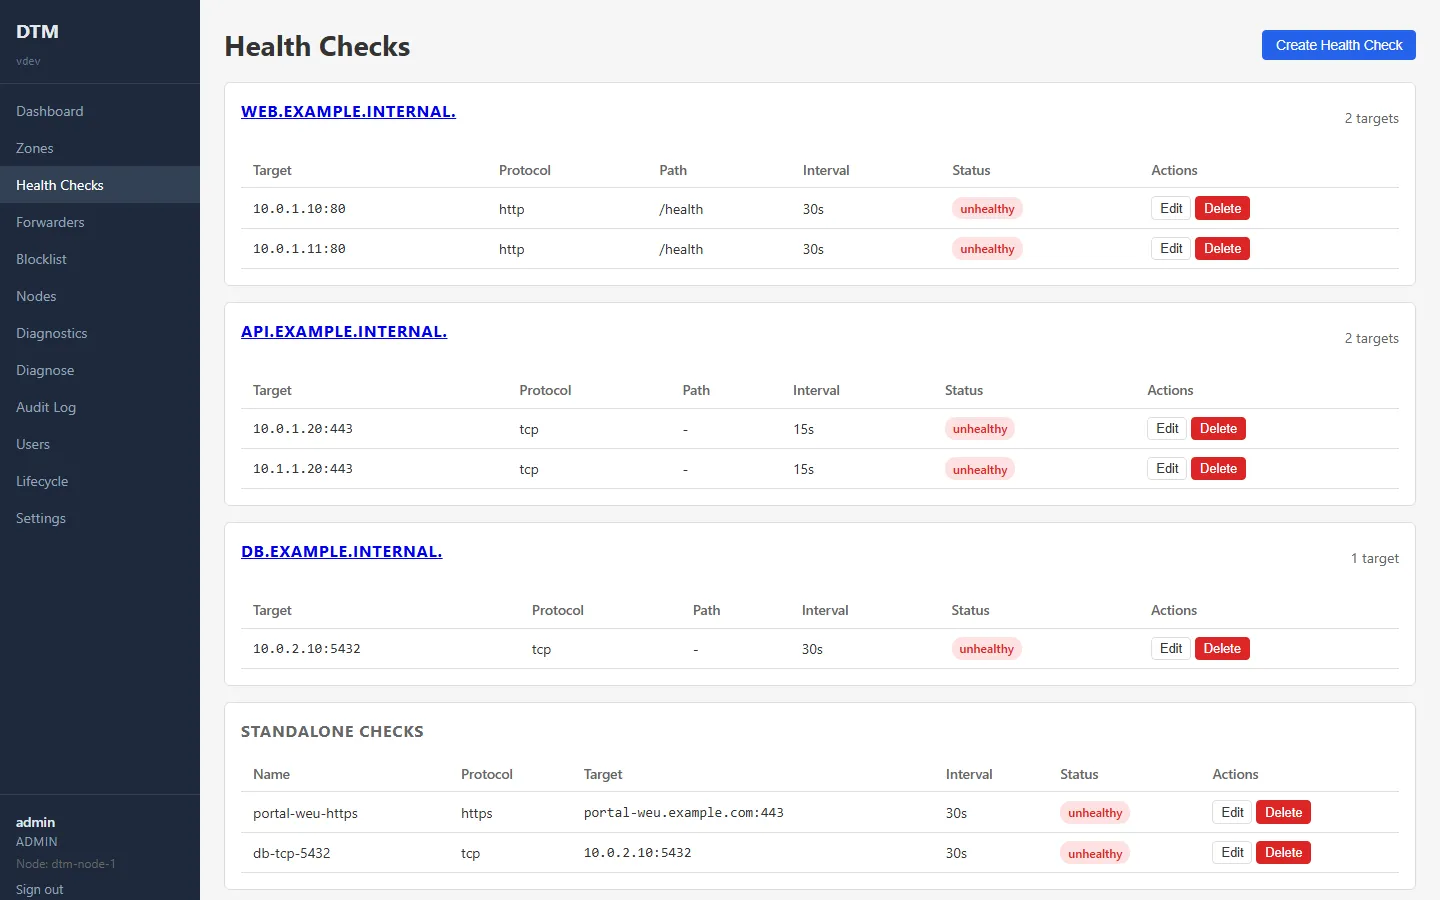
Section titled “View health and cluster status”- Health Checks shows each backend’s current health state, ordered worst first so a failing check is at the top. A summary bar counts unhealthy, degraded, pending, and healthy checks, and filter chips narrow the page to one status; the live badge updates never reorder or refilter the list under you. Checks that gate records are created from the record form; record-less monitor-only checks (status metrics only, no DNS effect) are created through the API and can be edited and deleted here.
- Nodes lists every cluster member with its status (
alive,suspect,dead,left), region, and version. Use it to confirm the cluster is whole, for example before a rolling upgrade. Removing a node from here asks you to type its name and spells out the consequences first, and the removal is recorded in the audit log; follow the order in removing nodes. - Dashboard summarises query volume, zone and record counts, and cluster health.
Configure forwarding and the blocklist
Section titled “Configure forwarding and the blocklist”- Forwarders manages the default forwarder, conditional forwarders, and stub
zones. Each conditional forwarder and stub zone has a Test button that
queries its upstreams directly (bypassing the cache and the resolution
pipeline) and interprets the result per upstream, so the one dead upstream in
a list is obvious; a bare
NXDOMAINreads as “the upstream answered, but has no record for this name” rather than a failure. See forwarders and stub zones. - Blocklist manages the suffix-matched denylist.
Manage users and settings
Section titled “Manage users and settings”- Users (admin only) is where you add users, set roles, and disable accounts. Your own row has no Delete action (the server refuses self-deletion), and the last enabled admin can be neither deleted nor disabled, so an organisation cannot lock itself out.
- Settings covers subnet mappings and discovery scopes (including management-group scopes: a picker lists the groups the identity can see, expands one into readable and unreadable member subscriptions with an optional verified probe, and you confirm the set you are authorising), TSIG keys, backup and restore, the region-discovery backend, delete guardrails, forwarder hardening, the discovery review flow (discovery detects; you apply: a status line shows pending drift, including management-group membership changes, Review changes opens the diff, and Apply re-discovers and writes; removals are only offered from a complete observation), transport protocols (DoT and DoH), service accounts (admin only: create with an optional zone scope, show-once token, revoke), and other cluster-wide configuration.
- Audit Log shows a filterable log of who changed what: filter by user, action, resource, and a From / Until date range. The NDJSON export link honours the active filters, dates included, so “export what I am looking at” does what it says.